
Graphs of functions seem like they should provide great insight into the behavior of the quantities they describe. I mean, c’mon. They’re visual ways to view the relationship. And that’s how humans experience and understand the world primarily: visually. Graphs seem perfect, then. So what’s the problem?
The problem is that graphs don’t look like the quantities they describe. For example, let’s say the number of birds living in a particular area increased at a relatively constant rate from 10 to 20 over the course of 2 months. What does this look like? It looks like a mini-movie that has 10 birds on the screen. Then, over a period of time, additional birds get added to the movie, one-by-one, until there are twenty. In other words, it looks something like this:
A graph of this story, on the other hand, looks like this:
For another example, imagine a machine piece that pivots according to the function 


The graph, unfortunately, looks like this:
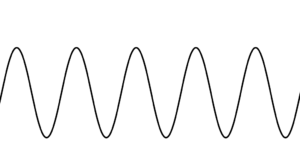
Humans experience their world as moving, visually changing stories that involve objects engaged in actions:
birds migrating to an area
robot arms swinging back and forth
A graph is a static, visually motionless picture of a single object that bears no resemblance to its source and is not engaged in any action:
slanted line segment
wavy curve
The fact that graphs are currently our go-to way of “visualizing” functions means that our students have almost no chance of understanding what mathematics means. For a person who isn’t extremely well versed in mapping graphs to direct experience, graphing a function is like translating a paragraph from Spanish to Italian.
Simulations, on the other hand, are like magic. When designed correctly, they have the ability to translate a symbolic mathematical function into something that even a person with no mathematical knowledge can easily make sense of. For example, here is the simulation I used to produce the robot arm image above. The arm is currently set to rotate according to the function
What about the migrating birds? Here’s a simulation that allows users to experience changes in the number of discrete objects over time. It’s currently set to simulate our bird example, where the number of birds increases from 10 to 20 over 2 months using the function 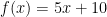

These simulations allow students to get direct experience with functions that describe concrete contexts. They can try tons of different functions and immediately see their effect on the quantities they describe. They can make slight alterations to functions and immediately see how this alteration expresses itself in the actual context. It’s remarkable.
Using these simulations feels similar to translating a web page. When you open a web page that is in a different language, it is a wall of meaningless jargon. Then the button appears at the top asking you if you would like to translate the page. When you click that translate button and the whole page instantly turns into English, it’s like a floodgate of meaning opens up.
![]()
Using these simulations has the same effect. They take highly abstract symbolic mathematical functions and instantly translate them into direct, meaningful concrete experience.
This creates a completely new type of mathematical literacy. How fluent are your students in the use of quadratic functions to describe and govern rotations? How fluent are your students in using trigonometric functions to describe and govern temperature? How fluent are your students in using inverse functions to describe and govern luminosity? The answers to these questions will be largely dependent on the number of structured hours your students have spent engaged with simulations like this.
My current goal is to develop a set of standard simulations that can be used to explore the vast majority of contexts and then develop instructional resources to support their use. I genuinely believe that this approach has the ability to drastically affect the future direction of mathematics education. My upcoming posts will be dedicated to fleshing out this paradigm and releasing new resources related to it.
I hope you have many questions, thoughts, concerns, and additions. Please put them in the comments so we can start a conversation.
Hi Harry,
The one thing I find challenging with simulations, although I love them, is that they typically don’t leave a visible trace of what the relationships being compared are; which is a key advantage of a graph — one can trace all of the relationships between a pair of variables at the same time. Simulations are time-bound and each frame shows at most one aspect of the relationship.
This seems like more of an instructional hurdle. How do I help learners interact with a simulation so that they can get a sense of the overall picture via the simulation, but be able to compare concrete instances of the simulation at different moments?
David
Hi David,
Thanks for the comment. I like your recognition that it is not the simulations themselves that will cause learning, but the ways in which learners interact with them. This is an area I am having a lot of fun exploring at the moment.
Here is a question I am currently wrestling with, for instance:
If you asked a student to describe the activity in the simulation using mathematical language, what would you want them to say? The answer is certainly different for each simulation, but the language we want them to use needs to be thought out carefully.
Regarding the big picture, I am not necessarily worried about learners perceiving all of the relationships between the variables as a whole. In fact, I think that is one of the strengths of the simulation over the graph, instead of vice versa. Seeing a movie of the function playing out over time is, I think, more perceivable and memorable as a complete picture of what’s happening than the graph. Even though the viewer only sees one frame at a time, they perceive the story as a whole, just like in a movie.
Lastly, I like your wording when you say we have to “help learners interact with a simulation so that they can get a sense of the overall picture via the simulation, but be able to compare concrete instances of the simulation at different moments”. It’s a good summary of some of the instructional support work that needs to be done.
Thanks again.
Harry
This has been on my mind all summer (teaching calculus). Was just tweeting with Heather Johnson and it came up again.
a) So, thanks
b) Is this even richer in context or is that a distraction?
c) Silly penguin simulation https://www.geogebra.org/m/snAVHEuC
Hi John,
I sincerely apologize for the delay in response (and comment approval!). I’ve had a whirlwind of a last month of school.
Is this even richer in context? I assume you mean when working with the actual objects in question. Like an actual robot arm or actual birds? If so, that’s what I started developing a framework for in my blog post “How to Change the World with Mathematics”. It outlines a way to have learners represent contextual phenomena in 4 ways: concrete, simulation, words, and math symbols. Is this what you meant?
Love the penguin simulation, although I’m not sure I understand it fully. For instance, when the pattern is 8 + 1 – x and t=11, the number of penguins is still increasing. Shouldn’t it be decreasing, since 8 + 1 – 11 = -2 ? Either way, it is exactly the type of thing I was advocating for. On another note, your simulation really helped me get the experience of trying to use someone else’s and make sense of it. Great experience.
Thanks for the comment and sorry again for the delay.
Grr. Just lost a comment by clicking my own link.
By context I meant the difference between something like the penguins or a real world problem modeled vs a purely abstract/algebraic simulation. Your birds are on the border. Most of Fawn’s visual patterns are abstract. I wonder if there’s a difference for students engaging in the simulation or the algebra. Should the algebra be hidden (https://www.geogebra.org/m/UGDGFGD2 or https://www.geogebra.org/m/xyhbjMR8 or https://www.geogebra.org/m/JTYR6QSZ) or showing like in the penguins? (I think my native preference must be saving the symbolic for later, so more examples of that. )
PS. I think the penguin mishap is because the actual function is based on the minutes set, but the display only changes if you click in there.
PPS No worries about the delay. This is a big idea post! I’ll be coming back.
I get what you mean now about the context vs. abstract. Your three examples made it plain. Those are cool!
In my opinion, the simulations should be as real as possible. They should look and feel as close to the actual stimuli as they can. In my vision, that is the purpose of simulations. So, from that perspective, the penguins is great. The only negative is that the penguins one can only be used for penguins! So making simulations for a lot of contexts is unreasonable. What I am trying to do is make a standard set of simulations that can be used for many purposes. The birds simulation, for example, can be used for any situation where the input is time and the output is a certain number of discrete objects. That’s a lot of contexts.
As for hiding vs. showing the algebra. I think our job, at a basic level, is linking symbolic mathematics to concrete instances mentally. I wrote a blog post that fleshed out a method for doing that here:
https://harryomalley.com//2017/05/how-to-change-the-world-with-mathematics/